6.5 Good practices
🔍 Fundamentals of Data Visualization - Claus O. Wilke
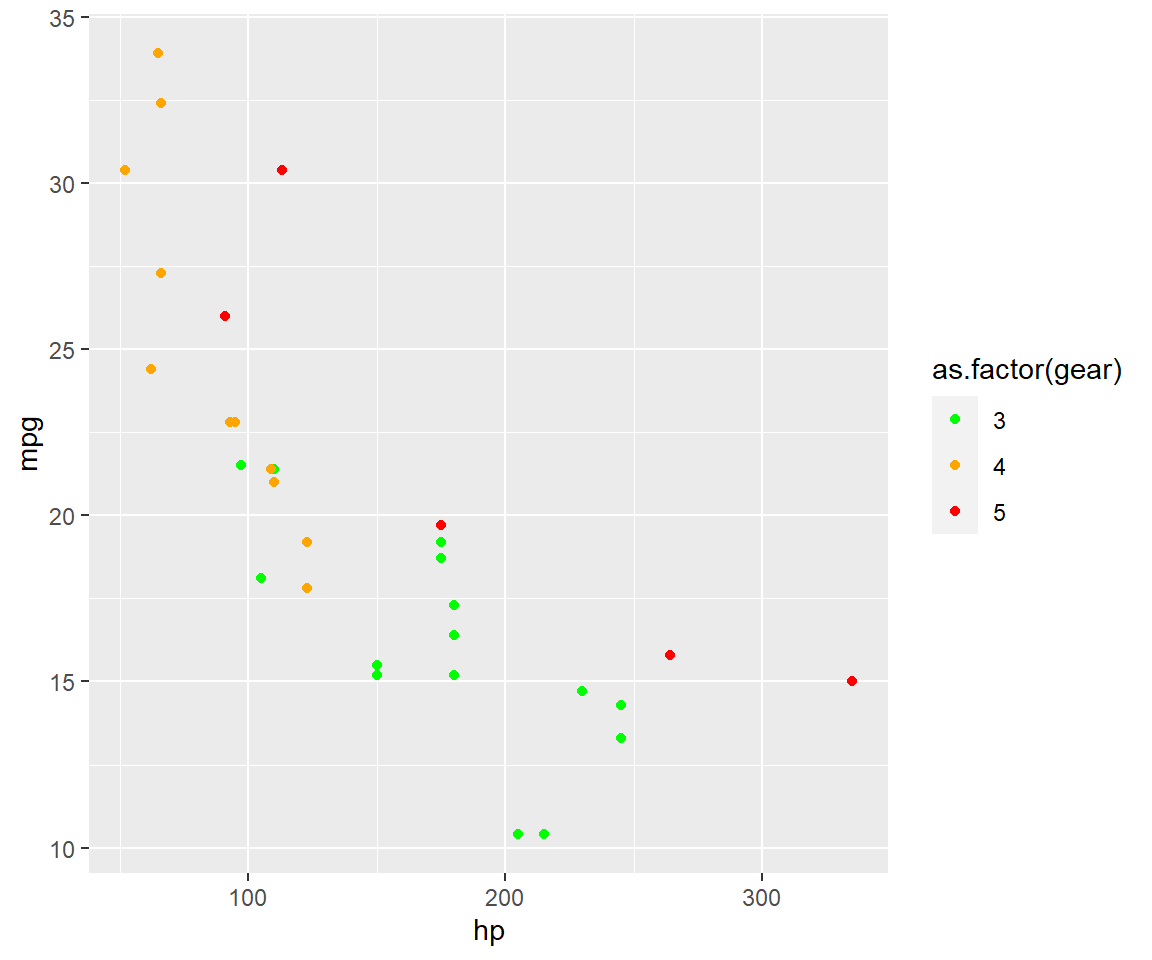
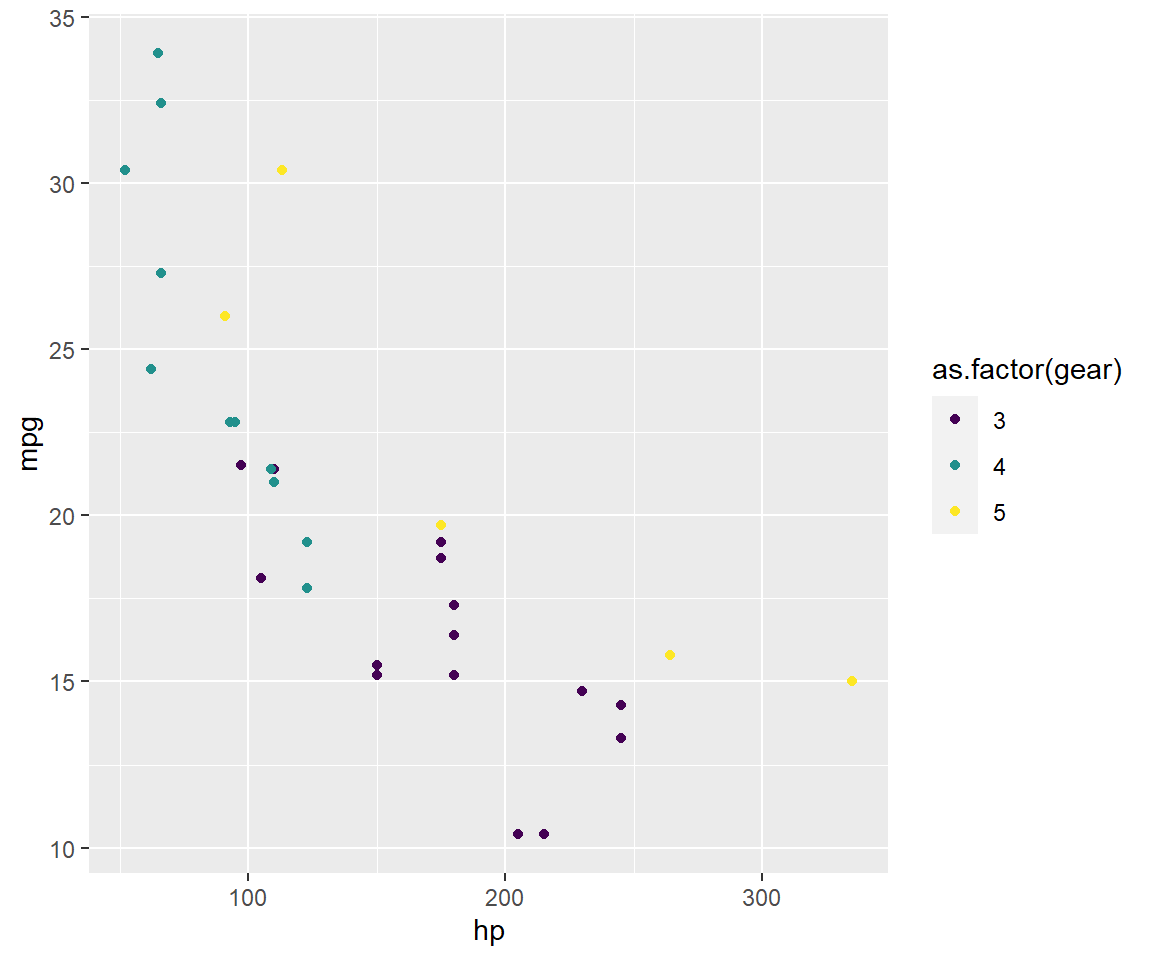
Ein nicht unerheblicher Teil der Menschen hat eine rot-grün Schwäche und darum ist es gut, diese Farben nicht explizit zu verwenden. Die viridis Farbpalette bietet tolle Farben die für ästhetische Abbildungen zusammengestellt wurden. Eine andere Möglichkeit ist das package RColorBrwer.
# default Farben
mtcars %>%
  ggplot(aes(hp, mpg, color = as.factor(gear))) +
  geom_point()
# Manuell gesetzte Farben (schlechte Farbwahl)
mtcars %>%
  ggplot(aes(hp, mpg, color = as.factor(gear))) +
  geom_point() +
  scale_color_manual(values = c("green", "orange", "red"))
# Benutze das viridis package
mtcars %>%
  ggplot(aes(hp, mpg, color = as.factor(gear))) +
  geom_point() +
  scale_color_viridis_d()
“There are three fundamental use cases for color in data visualizations: (i) we can use color to distinguish groups of data from each other; (ii) we can use color to represent data values; and (iii) we can use color to highlight.” - Claus Wilke, Fundamentals of Data Visualization
🚨 Sei konsistent bei der Farbwahl in deinem Projekt, Manuskript, Abschlussarbeit. Das erleichtert es dem Leser deine Story oder die Aussage deiner Arbeit zu verstehen.
🚨 Coloriere nur wenn es auch wirklich wichtig ist und es eine Bedeutung in der Abbildung hat.

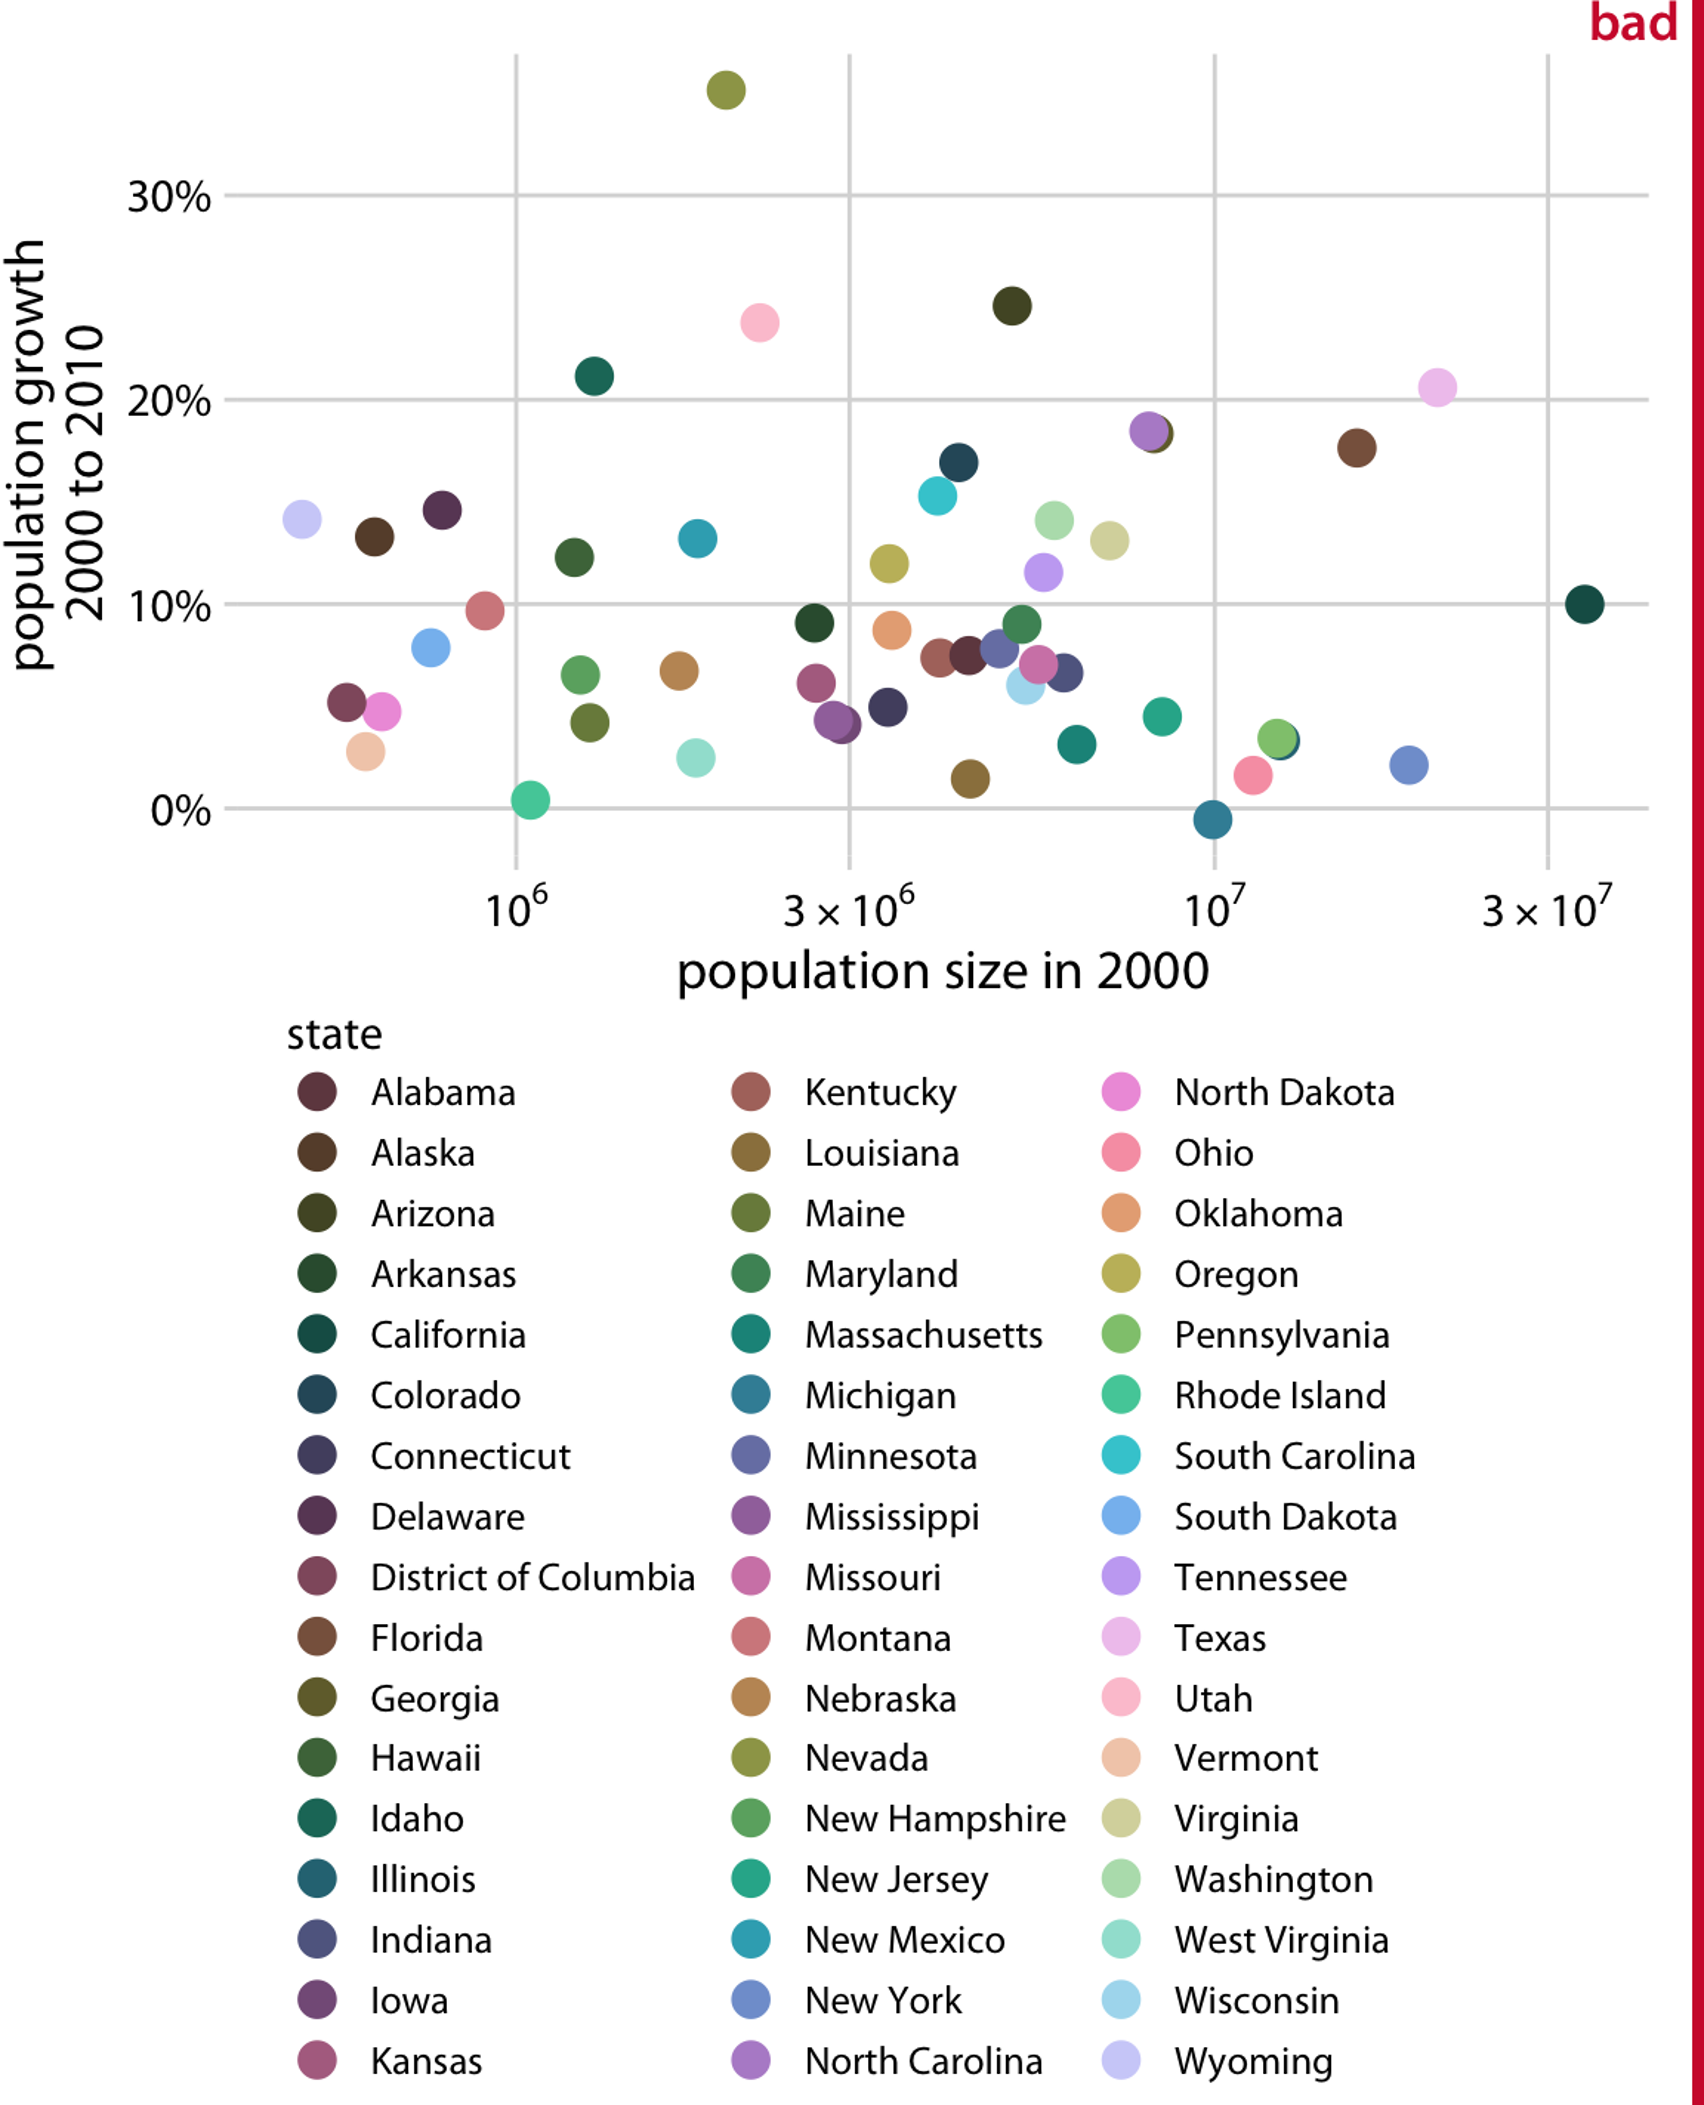
Figure 6.5: Source from: https://clauswilke.com/dataviz/index.html
“Even if with a lot of effort we can figure out exactly which state is which, this visualization defeats the purpose of coloring. We should use color to enhance figures and make them easier to read, not to obscure the data by creating visual puzzles.”