6.8 Farbauswahl
R bietet eine gigantische Auswahl an Farben, wo man schnell den Überblick verlieren kann.
Das einfachste ist man wählt die Name über den Namen direkt aus, rot ist bspw. "red".
Eine große Auswahl gibt es über das Paket RColorBrewer, wo man auch das Argument setzen kann ausschließlich Farben zu wählen für Farbblinde:
display.brewer.all(colorblindFriendly = T)
Ein weiteres Standardpaket ist viridis, wobei diese Farben alle für Farbblinde erstellt wurden.
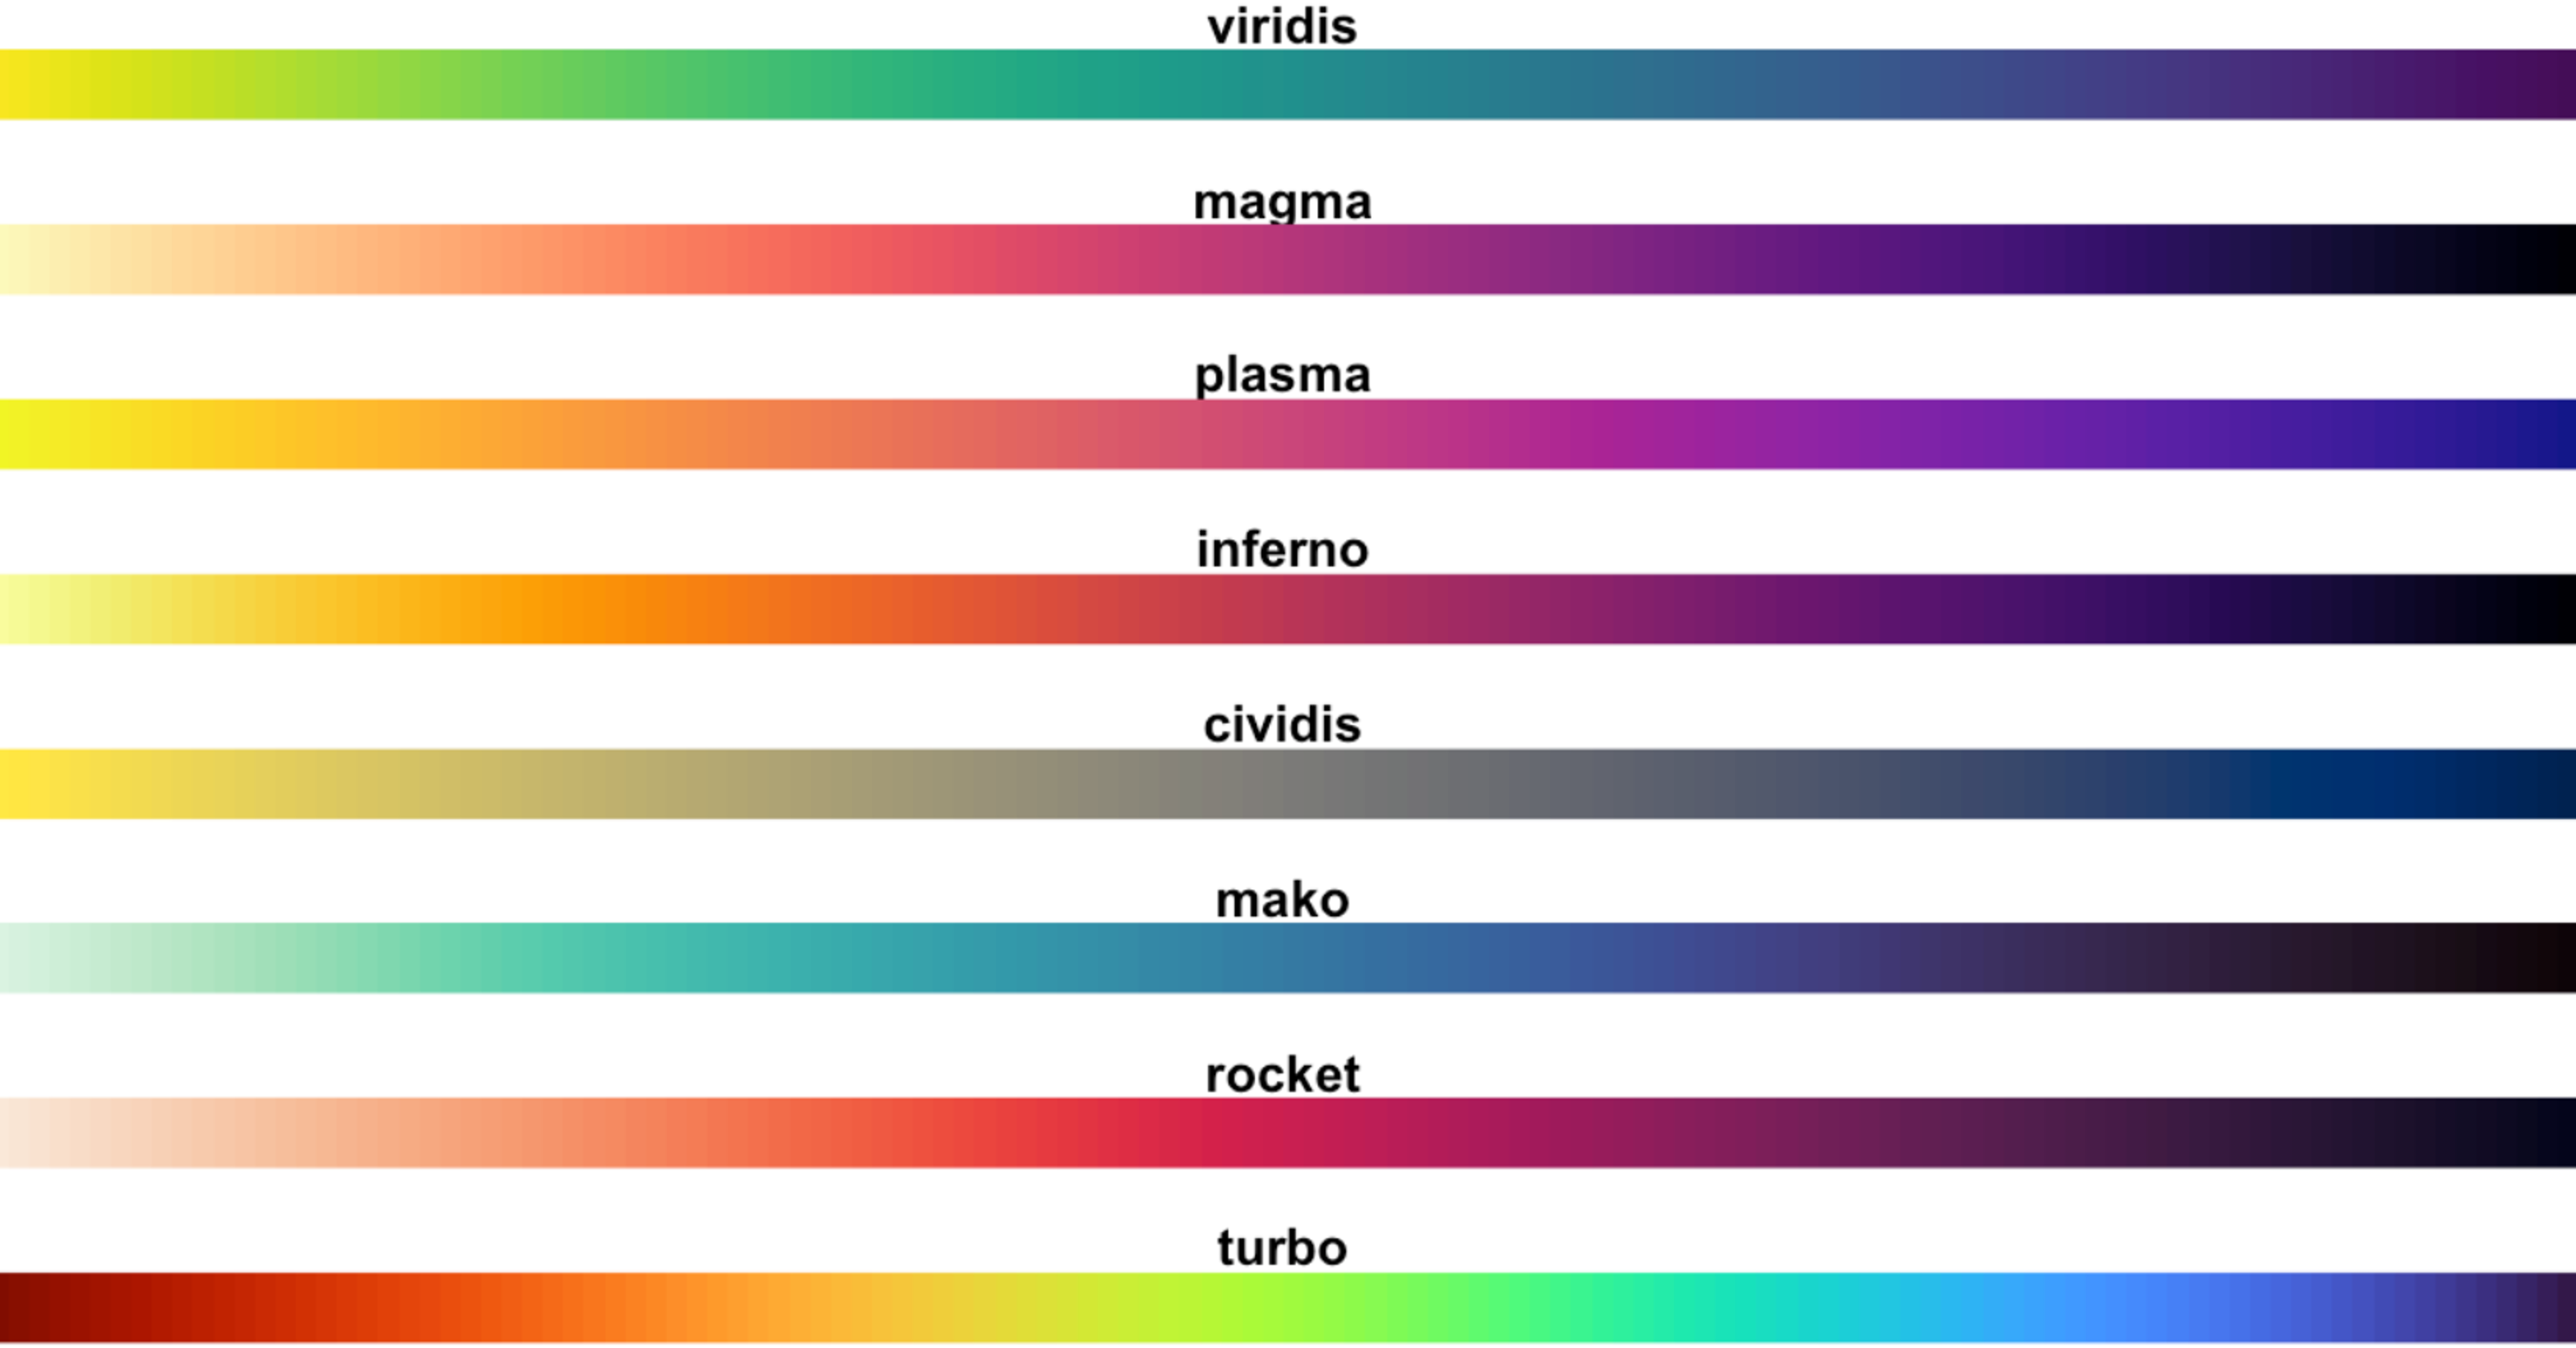
Figure 6.6: Source from: https://cran.r-project.org/web/packages/viridis/vignettes/intro-to-viridis.html
Eine weitere Möglichkeit Farben aus einem Bild, bspw. einem Luftbild, zu extrahieren geht mit dem package earthtones.
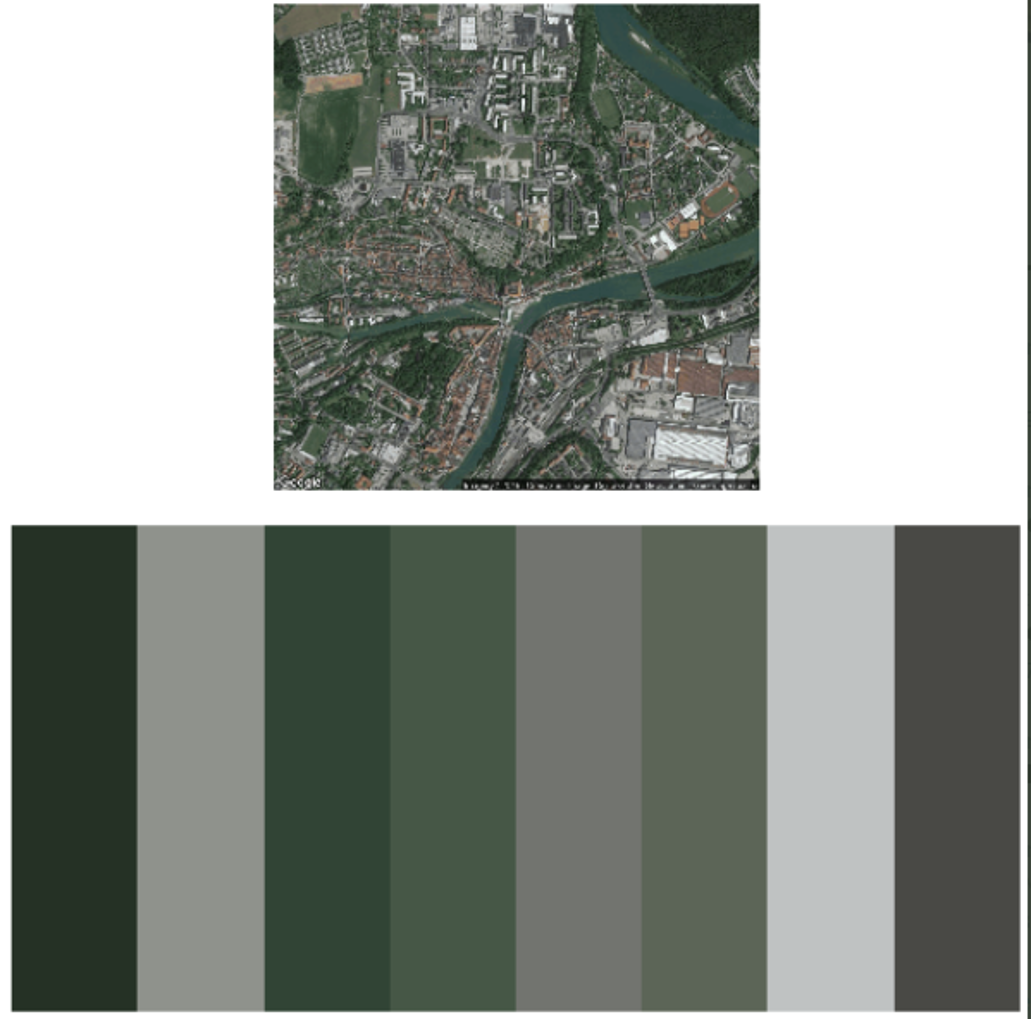
Figure 6.7: Source from: https://cran.r-project.org/web/packages/earthtones/index.html
Richtig spannend ist auch das package palleteR, um Farben aus einem Bild zu extrahieren und zu verwenden.
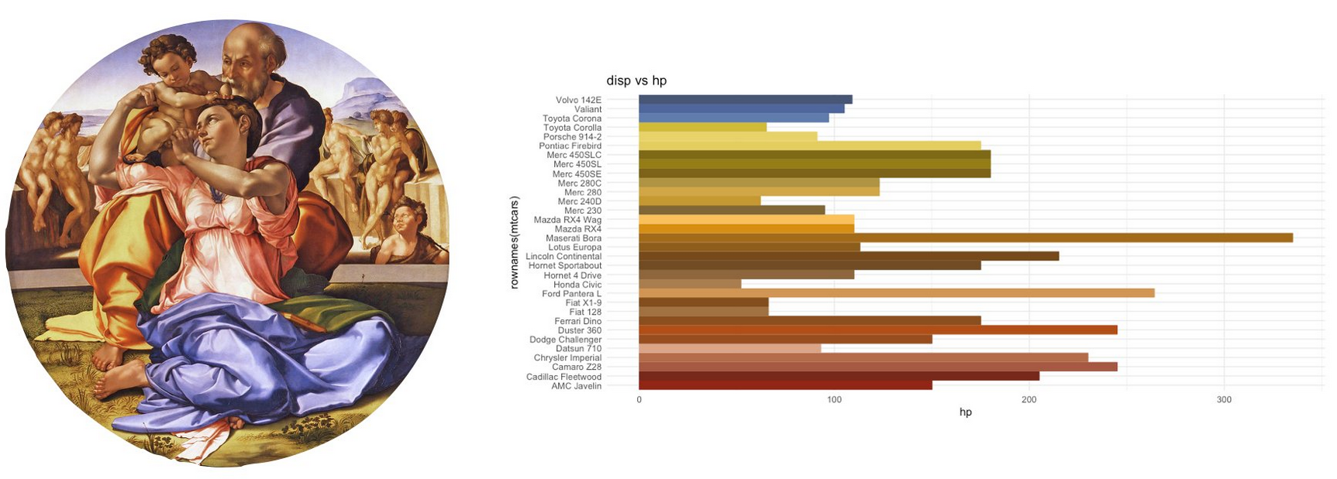
Figure 6.8: Source from: https://github.com/AndreaCirilloAC/paletter
Wer selber Hand anlegen möchte um Farben zu generieren, dem ist diese Seite wärmstens ans Herz gelegt https://projects.susielu.com/viz-palette.
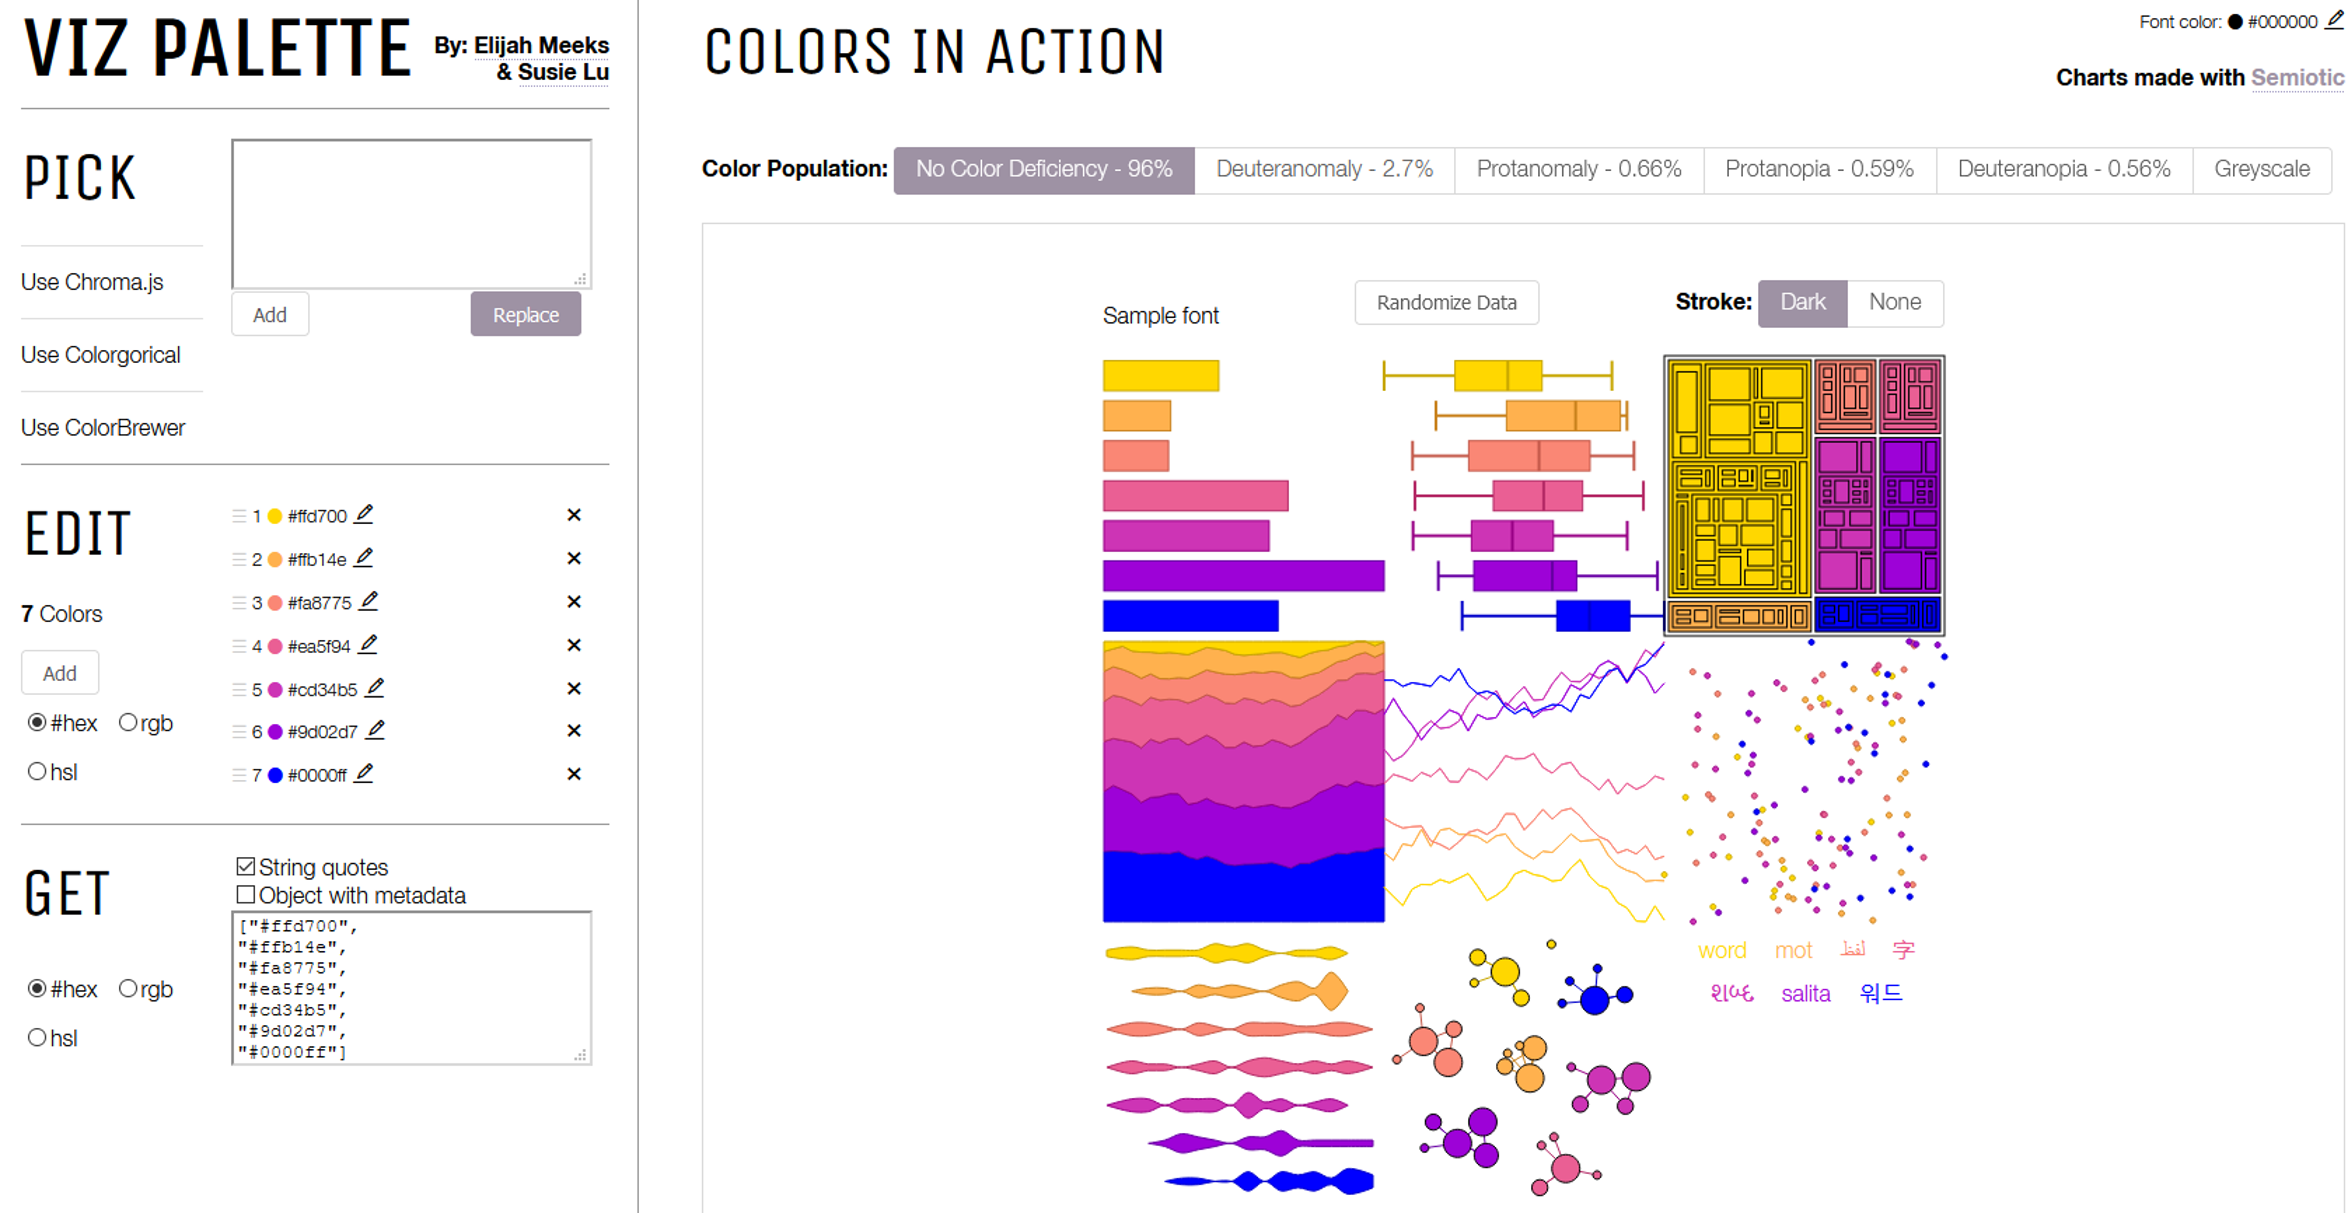
Figure 6.9: Source from: https://projects.susielu.com/viz-palette
6.8.1 Beispiele für unterschiedliche Farben
# select the data
lolli <- koog_day %>%
  pivot_longer(contains("eh") & !contains("mean"))

# create a name vector to sort the depth variables
col_names <- rev(c("eh10a","eh10b","eh10c",
                   "eh20a","eh20b","eh20c",
                   "eh30a","eh30b","eh30c",
                                           "eh60a","eh60b","eh60c",
                                           "eh100a","eh100b","eh100c",
                                           "eh150a","eh150b","eh150c"))

# Plot the data with default color
lolli %>%
  ggplot(aes(value, fct_relevel(name, col_names), color = name)) +
  geom_boxplot() +
  labs(
    x = expression(paste("E" [H], " (mV)")),
    y = "Elektrode"
  ) +
  my_theme +
  theme(legend.position = "none")
# Plot the data with manual color
lolli %>%
  ggplot(aes(value, fct_relevel(name, col_names))) +
  geom_boxplot(color = "red", fill = "blue") +
  labs(
    x = expression(paste("E" [H], " (mV)")),
    y = "Elektrode"
  ) +
  my_theme +
  theme(legend.position = "none")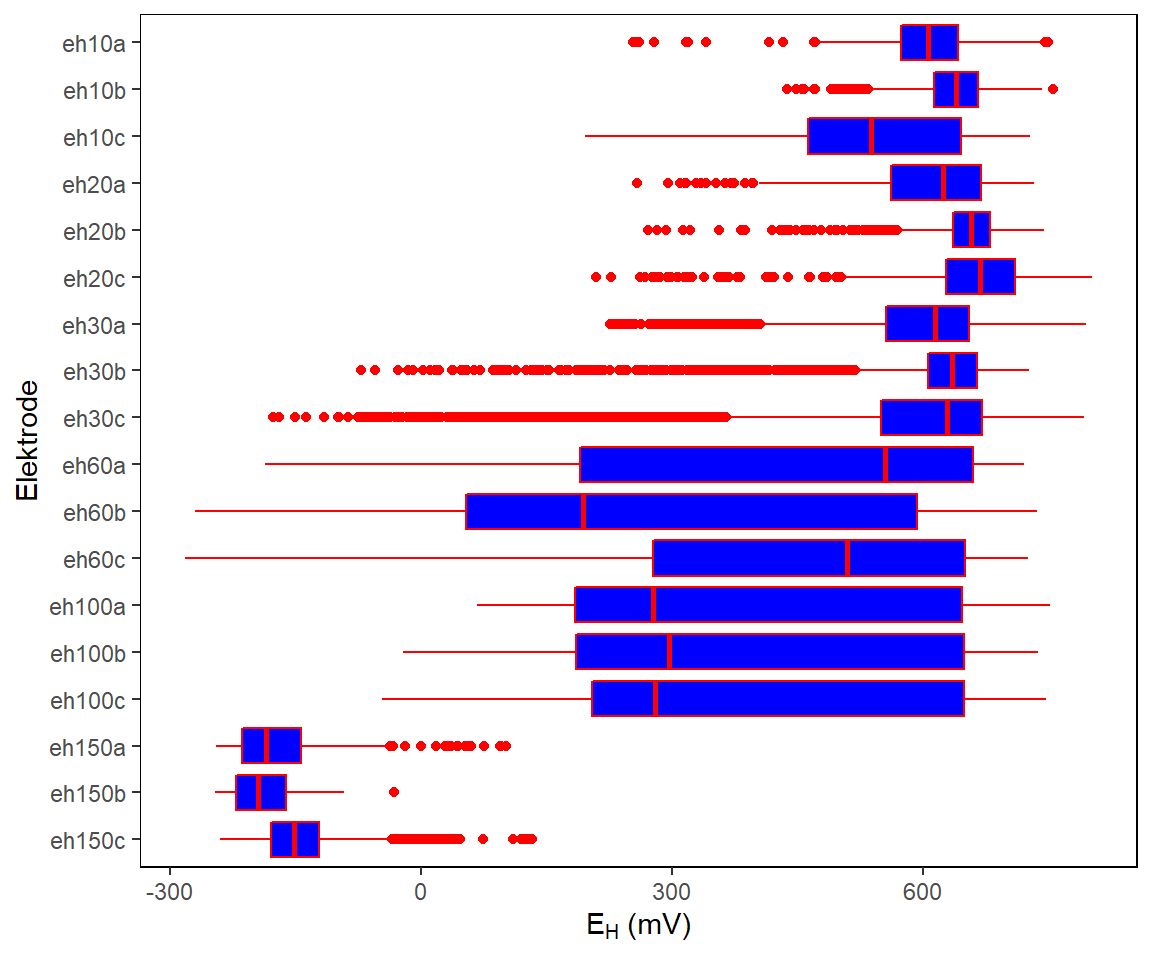
# Plot the data with scale_fill_brewer and various palletes
lolli %>%
  ggplot(aes(value, fct_relevel(name, col_names), fill = name)) +
  geom_boxplot() +
  labs(
    x = expression(paste("E" [H], " (mV)")),
    y = "Elektrode"
  ) +
  scale_fill_brewer(palette = "PuBu") +
  my_theme +
  theme(legend.position = "none")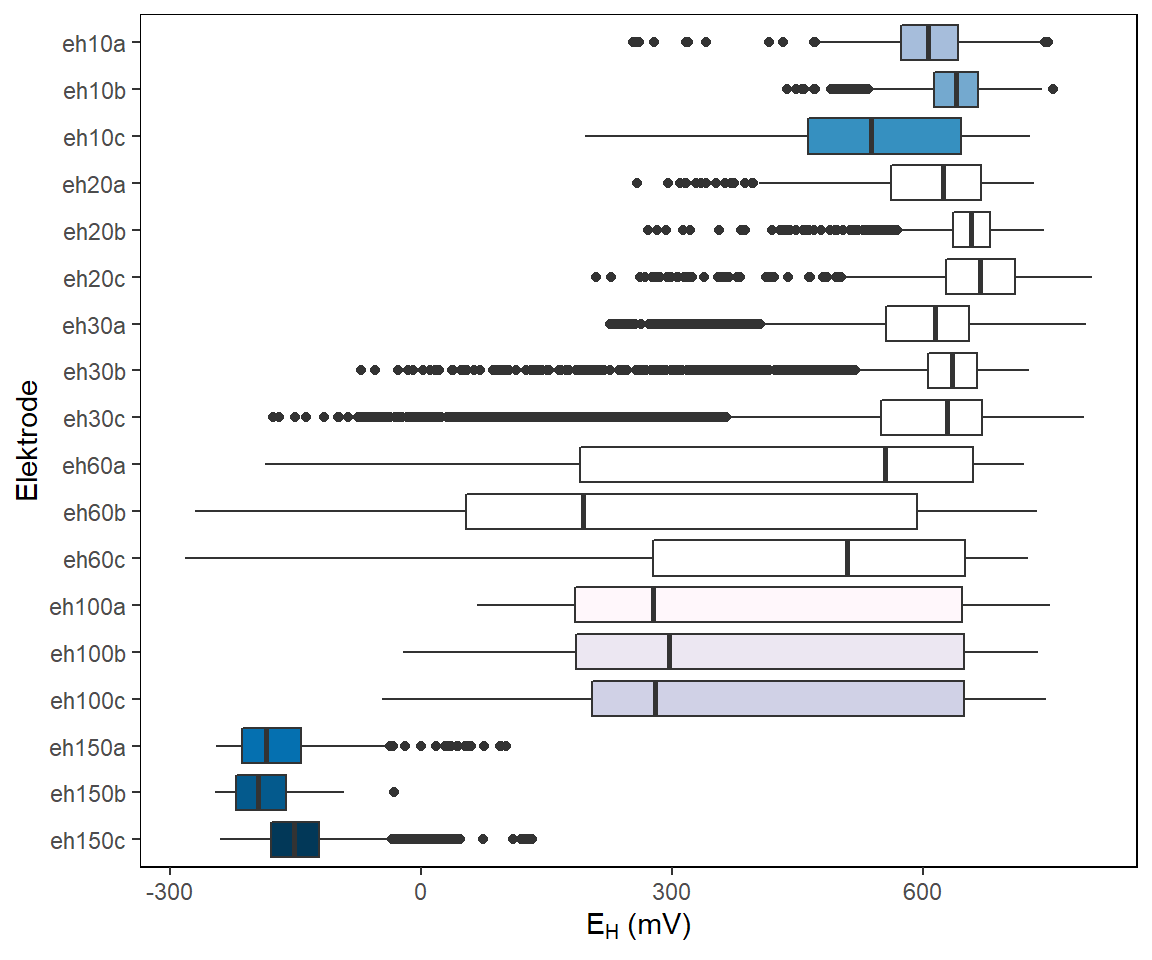
# Plot the data with viridis color
lolli %>%
  ggplot(aes(value, fct_relevel(name, col_names), fill = name)) +
  geom_boxplot() +
  labs(
    x = expression(paste("E" [H], " (mV)")),
    y = "Elektrode"
  ) +
  scale_fill_viridis_d() +
  my_theme +
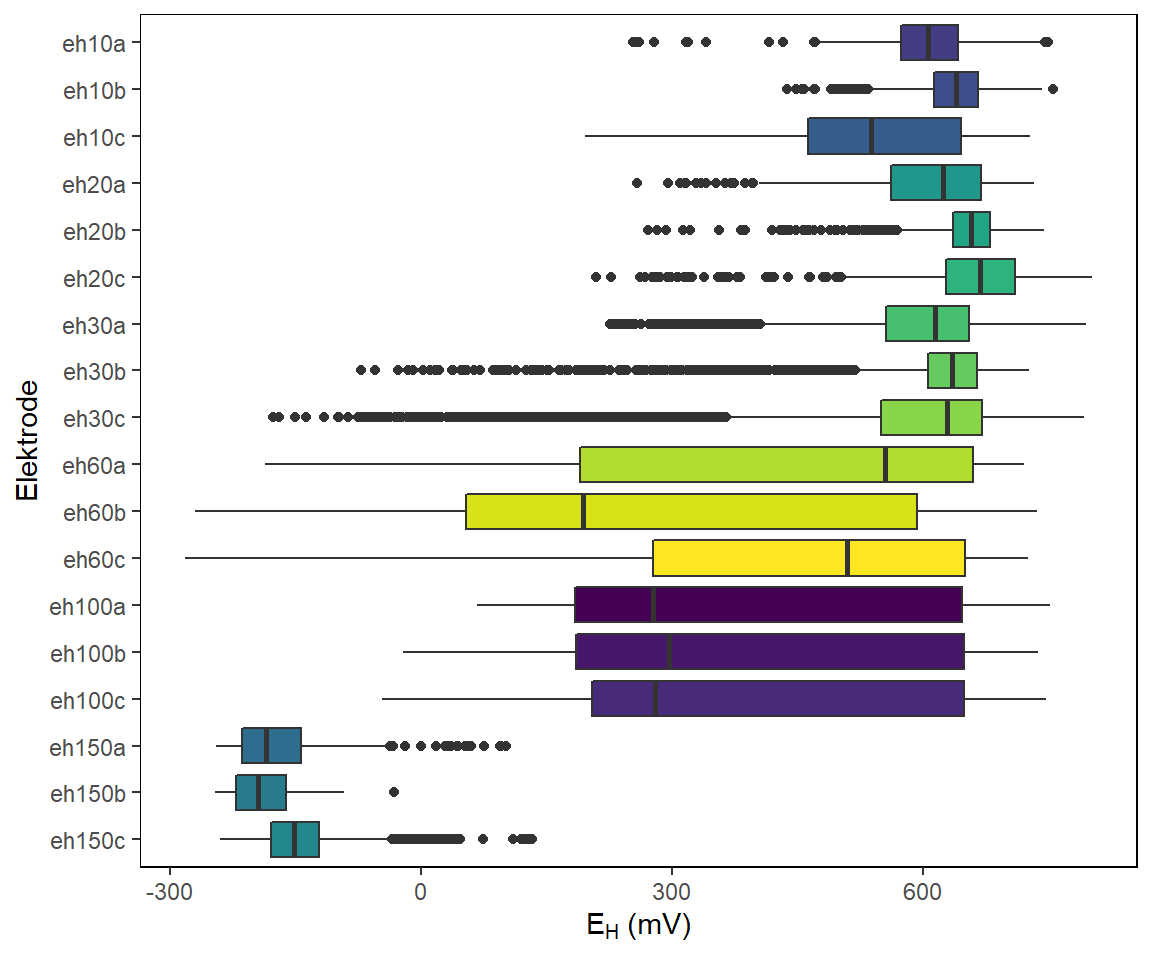
  theme(legend.position = "none")